Getting Started with Grafana: A Beginner's Guide to Data Visualization and Dashboard Creation
INTRODUCTION :
Grafana is a powerful and popular data visualization tool that enables users to create interactive and customizable dashboards to display and analyze data from various sources. Whether you are a data analyst, engineer, or developer, Grafana offers a user-friendly interface that makes it easy to create insightful visualizations, alerts, and reports.
In this beginner's guide to Grafana, we'll cover the basics of the tool and provide step-by-step instructions to help you get started with creating your own dashboard. We'll start by explaining what Grafana is and what it's used for, and then we'll walk through the process of setting up and configuring your first dashboard. Along the way, we'll cover the most important concepts and terminology you'll need to know, and we'll provide tips and best practices to help you create effective and visually appealing visualizations.
Whether you're a complete beginner to data visualization or just new to Grafana, this guide will provide you with the knowledge and skills you need to create your own custom dashboards and make the most of your data. So, let's get started!
The short architecture of Grafana:
Grafana follows a client-server architecture where the Grafana server acts as the backend and the web browser serves as the frontend. The server communicates with various data sources, such as databases or APIs, to retrieve data and generate visualizations, which are then rendered and displayed in the web browser.
Grafana also supports plugins, which can be used to extend its functionality and connect to additional data sources. The tool can be deployed on various platforms, including on-premises servers or cloud-based environments, and can be configured to support high availability and scalability. Overall, the architecture of Grafana is designed to be flexible, modular, and easily extensible to support a wide range of use cases and data sources.
Is the architecture Pull-Based or Pushed-Based? :
Grafana is a pull-based system, which means that it retrieves data from data sources by making requests for data at regular intervals, rather than waiting for data to be pushed to it. This is accomplished through the use of data source plugins, which allow Grafana to connect to a wide range of data sources, including databases, APIs, and other data services.
Grafana's pull-based approach enables it to be more flexible and scalable than a pushed-based system, as it can handle a large number of data sources and requests without overwhelming the data sources or the Grafana server. Additionally, Grafana allows users to configure how frequently data is retrieved and how often the visualizations are updated, providing a high degree of control over the data and the dashboard display.
Grafana Cloud Setup Steps :
Go to the Grafana Cloud website (grafana.com/cloud) in your web browser.
Click on the "Sign in" button located in the top right corner of the page.
If you already have a Grafana Cloud account, enter your email and password and click "Sign in". If you don't have an account, you can create one by clicking the "Sign up" button and following the prompts. You can use various platforms to sign up.

Once you have signed in, you will be taken to the Grafana Cloud platform, where you can access your data sources, dashboards, and other features.
Creating Dashboard in Grafana:
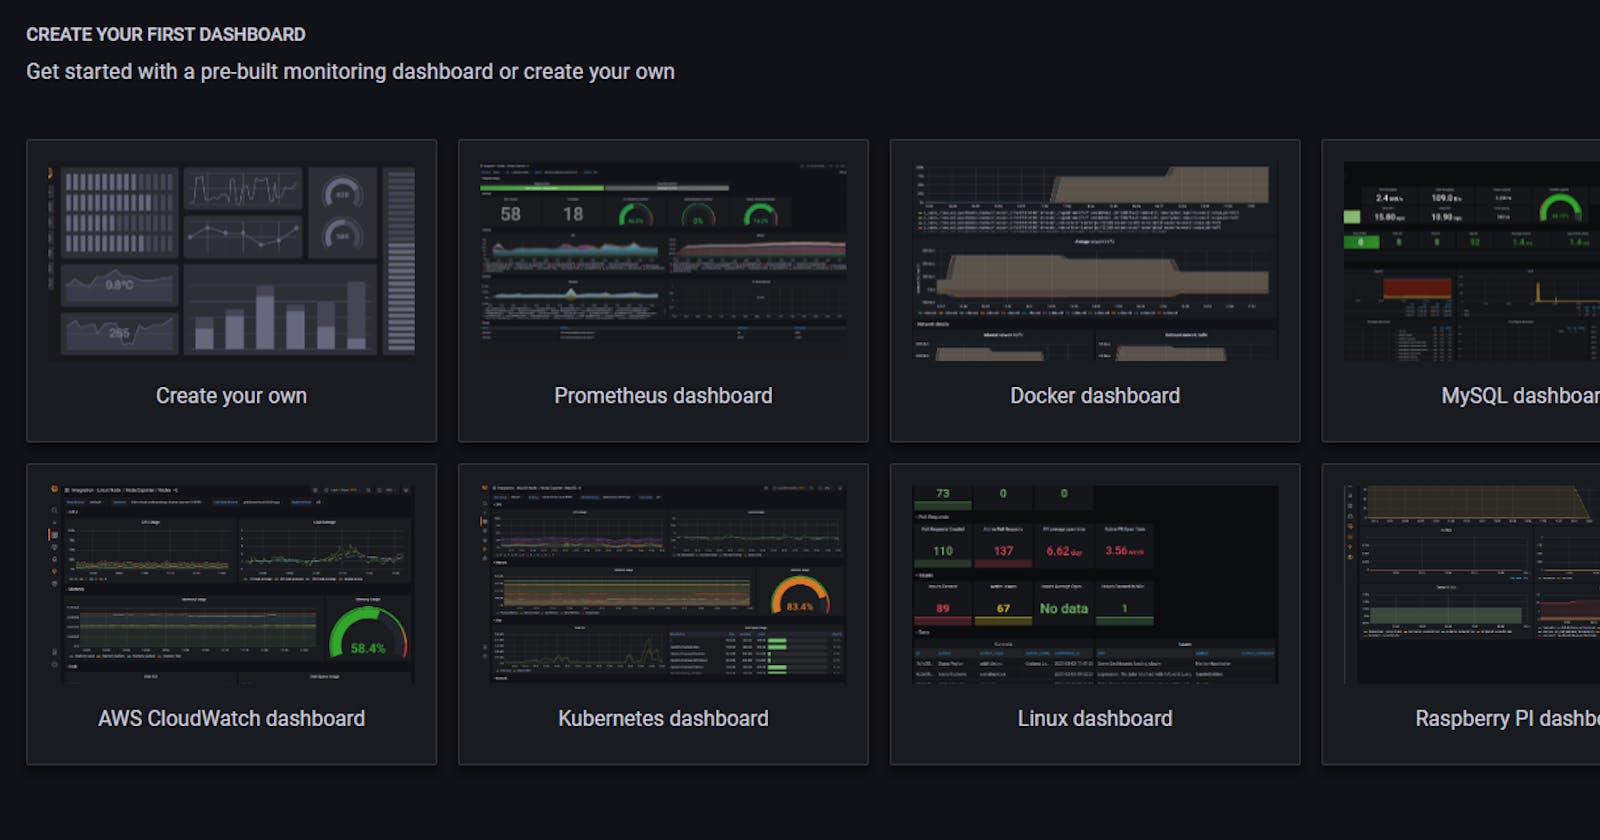
In the Login page click on "Create your own" dashboard page and select , for what you want to create a dashboard and it will open like below: (for me, I have used "linux server" as I want to monitor my Linux machine)

Now choose your OS type and in the Hostname section- provide the Public IP address of your linux server.
Scroll down to last and click on "Install Integration".

It will generate a token with the configuration, automatically generated with the above-added configuration.
Then, simply copy-paste and run the commands and it will install Grafana Agent on your server. Now just restart the daemon service.

Congratulation !!
Your grafana agent is running on the server.

To check your server data, click on Test Integration and click on "Dashboard".
It will show you your server's live data.

If you check, Node Explorer/Nodes, it will show you the node/server live OS health data.

In conclusion, Grafana is an essential tool for any organization looking to make sense of its data. With its user-friendly interface and advanced capabilities, it can help you visualize, monitor, and analyze your data in real time.
I hope you found this content informative and useful in understanding the potential of Grafana.
Surprise :
Next Blog will be about 'monitoring docker container through grafana'.
Thanks for reading, and I hope you enjoyed the article! :)
